In January The Atlas of Giving provided fundraisers with an in-depth look at 2012 giving, and a forecast of what to expect this year. In February Blackbaud came out with their view of 2012 and 2013. For a sector that for years had to rely on Giving USA, who will not report their numbers until June, it is great to see two companies working to give us more real-time insights.
Full disclosure, I am on the Board of Advisors of The Atlas of Giving. Even further disclosure, a company I founded – Prospect Information Network (P!N), is now part of Blackbaud. I also work and compete with Blackbaud, and have many friends there. I have no direct connections to Giving USA, but as a long-time social data geek I have used their data for many years.
So fundraisers are pouring over this wealth of data right? They are excited to see they can now have not only more timely yearly reports, but also monthly? Actually they are not. In fact it seems that we are spending more time arguing over the relative value of the data sources (be sure to read the comments) instead of focusing on how to use it.
When you look at reports on giving do you focus on the accuracy of the numbers or the trends they are showing? If your answer is accuracy then you are unlikely to use any of it for more than just presentation fodder. No industry has accurate numbers when it comes to reporting on its size or forecasting its future, yet every other industry mines the data each month to extract insights which drive decisions.
The debate about which vendor provides the best giving data highlights the challenge our sector faces as it begins to think about Big Data. Fundraisers are so busy arguing over whether it’s $320 billion or $337 billion, they completely miss the true value which is to look at their sector month over month, year over year, and compare it to their own results. With The Atlas of Giving you can even look at the sector by State!
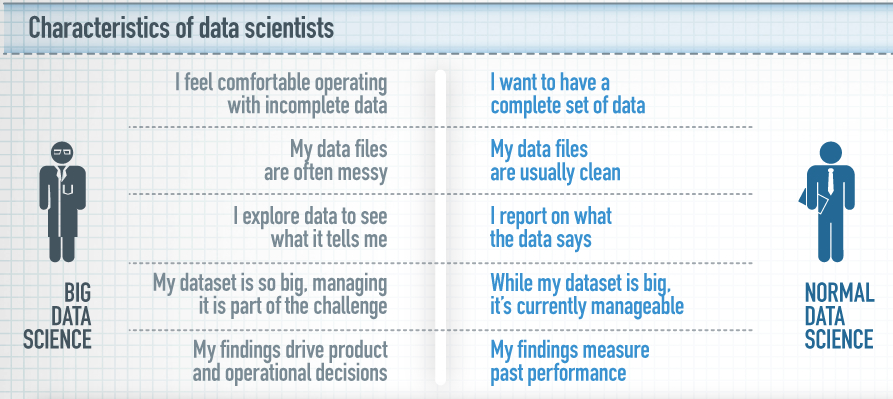
What do you do with the data? If you are thinking like a Big Data Scientist you are looking for whether your giving is moving with or against the trends. It is not a pass/fail where if the numbers don’t match up to your numbers it must be wrong. Think like Wal-Mart. They know their sales can actually increase when certain other retailer’s sales are down, so bad news can be good news for them. The same may be true for your organization. You might see a national downward trend in your sectors giving, but you are experiencing growth because your mission is focused on a hot area within the sector. That little nugget would be good to bring up at your next board meeting.
Speaking of board meetings, industry estimates and forecasting are something your leadership is used to seeing in their for-profit world. A big frustration for board members is the lack of data within our sector and how that leads to an overuse of anecdotal evidence to support why giving is up or down.
We are entering the era of Big Data. This is not a fad that will fade away. The ability to bring together data from across an organization and combine it with external sources has the potential to dramatically change fundraising, but first we must let go of perfectionism.
I just spoke at the APRA Mid Atlantic Research Conference in Northern Virginia about the small steps you can take to begin embracing Big Data. My goal was to make Big Data more approachable. Based on the feed-back I received there is clearly a desire to at least begin to explore the possibilities of Big Data.
In future posts I will explore ways the social sector can benefit from the actionable intelligence Big Data provides. In the meantime, I invite you to take another look at the resources around you using the mindset of a Big Data Scientist.  And for the vendors it’s time to follow your mother’s advice to “be big†and find ways to work together rather than tearing each other apart. Giving USA needs to accept that a June report about last year just doesn’t cut it anymore. Blackbaud needs to admit that their index is sorely lacking data from higher education and the collection plate. The ideal would be for those two to work with The Atlas of Giving so that a combination of sampling, IRS 990 data, and economic modeling can bring us an even richer dataset to help our sector grow Bigger.